Automating Nagios Monitoring with Puppet: Introducing confdroid_nagios
Keeping an eye on servers, services, and applications remains essential in any infrastructure. While newer tools gain attention, classic threshold-based monitoring with Nagios still delivers reliable, straightforward alerting for many environments.
The newly published confdroid_nagios Puppet module brings full automation to Nagios server setups — especially in traditional VM, bare-metal, or hybrid infrastructures.
Source: https://sourcecode.confdroid.com/confdroid/confdroid_nagios
What confdroid_nagios Delivers
This module handles the complete installation and configuration of a Nagios server (or client nodes) on Rocky Linux 9 (with Puppet 8 compatibility in progress).
Key highlights:
- Role-based deployment — If a node’s FQDN matches the configured
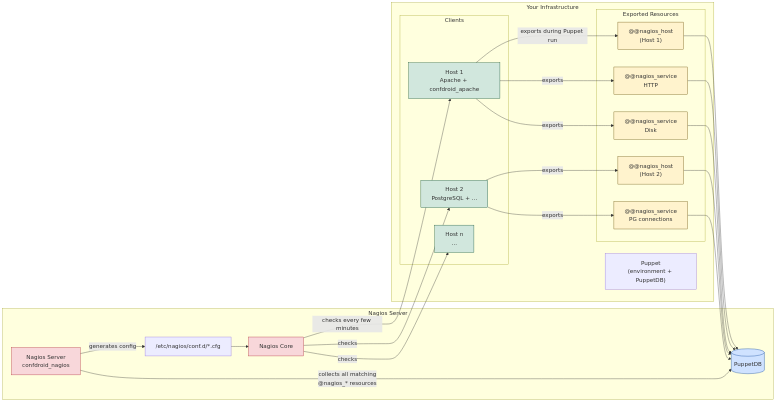
ng_nagios_server, it installs the full Nagios server stack. Otherwise, it deploys only client packages and NRPE (when enabled). - Dynamic configuration via PuppetDB — Hosts, services, contacts, contact groups, host groups, service groups, commands, and templates are all managed through exported resources. Other confdroid modules (like confdroid_apache) automatically export their monitored services — no manual host or check definitions needed.
- Secure and clean setup — Sets proper permissions, SELinux contexts, firewall rules, and creates a safe /etc/nagios/conf.d directory for any manual overrides without Puppet overwriting them.
- Integration features — Optional NRPE client setup (
ng_include_nrpe) and Fail2Ban jail for Nagios (ng_enable_fail2ban). - Admin UI access — Configures HTPasswd-based authentication with bcrypt-hashed passwords.
Once deployed with a simple include confdroid_nagios (and Hiera/ENC overrides for the server FQDN and credentials), Nagios stays current as your infrastructure changes — all driven by Puppet runs.
Threshold-Based vs. Metrics-Based Monitoring: A Quick Comparison
Nagios (and similar tools like Icinga) and Prometheus + Grafana represent two different philosophies. Both have valid places in modern setups.
Threshold-Based Monitoring (Nagios, Icinga)
- Approach — Actively runs checks (plugins, NRPE, SNMP) against hosts/services at set intervals. Returns OK/WARNING/CRITICAL/UNKNOWN states based on predefined thresholds.
- Strengths
- Excellent for uptime and availability alerting (“Is the web server responding? Is disk full?”).
- Strong dependency handling, scheduled downtimes, and notification routing.
- Simple to understand and configure for traditional infrastructure.
- Very effective for mixed VM/metal environments where you want clear “something is broken” alerts.
- Limitations
- Less suited for deep performance trending or high-cardinality data.
- No built-in long-term historical metrics storage or advanced querying.
- not very suitable for dynamic pods in Kubernetes
Metrics-Based Monitoring (Prometheus + Grafana)
- Approach — Pulls time-series metrics from instrumented targets (exporters, app endpoints). Stores everything in a powerful time-series database. Uses PromQL for querying and Alertmanager for notifications.
- Strengths
- Ideal for cloud-native, Kubernetes, and microservices — automatic service discovery, rich labels, and rate-based alerting (errors/sec, latency p99).
- Deep historical analysis, anomaly detection, and beautiful dashboards via Grafana.
- Handles high-volume, high-cardinality data well (with proper federation/scaling).
- Limitations
- Steeper learning curve (PromQL, recording rules, alerting rules).
- Less “out-of-the-box” for simple host/service availability without extra exporters.
- Operational overhead increases at very large scale without Thanos/Mimir.
When to Choose Which (or Both)
- Use Nagios / confdroid_nagios-powered setups for VM-heavy, bare-metal, or hybrid environments where clear, threshold-driven alerts and easy integration with existing Puppet workflows matter most.
- Choose Prometheus + Grafana for containerized, Kubernetes-native, or microservices-heavy stacks that demand detailed performance insights and trend analysis.
- Many teams run both — Nagios for critical “is it up?” paging alerts, Prometheus for capacity planning, SLO tracking, and debugging.
In short: Nagios excels at “something failed — notify the right person now.” Prometheus shines at “how is the system behaving over time — and why?”
Workflow
Get Started Today
Deploying automated, zero-touch Nagios has never been easier in Puppet-managed environments.
Add confdroid_nagios via your Puppetfile or r10k:
mod 'confdroid_nagios',
  git: 'https://sourcecode.confdroid.com/confdroid/confdroid_nagios.git'
Then configure your Nagios server node and let exported resources do the rest.
If you’re tired of manual Nagios config files and love declarative infrastructure, give it a try. It pairs beautifully with the rest of the confdroid collection for a clean, automated monitoring foundation.
Questions or feedback? The source is open — comments welcome!
Did you find this post helpful? You can support me.


Related posts
- Confdroid Puppet Modules – Pilot
- Confdroid Puppet Modules – Puppet
- ConfDroid Puppet Modules – confdroid_resources
- ConfDroid Puppet Modules – Postgresql
- ConfDroid Puppet Modules – Gitea
- ConfDroid Puppet Modules – Apache
- ConfDroid Puppet Modules – NRPE
- ConfDroid Puppet Modules – Fail2ban
- ConfDroid Puppet Modules – Automatic
- ConfDroid Puppet Modules – Selinux
- ConfDroid Puppet Modules – SSH
- ConfDroid Puppet Modules – java
Author Profile
Latest entries
 blog24.06.2026CNPG – considerations for migrating databases
- blog14.06.2026CNPG – Cloud Native Postgresql – Pilot
 blog18.04.2026ConfDroid Puppet Modules – java
- blog18.04.2026ConfDroid Puppet Modules – SSH