“Modern infrastructure, whether it’s a single server or a Kubernetes cluster, produces tons of metrics and logs. Without proper monitoring, it’s like flying blind.”
That’s right. Imagine you drive around with your car day-in day-out without ever checking the oil or refilling the tank, simply because you did not know it was due. Eventually you get stranded and might have to pay some good money to get going again.
In IT it is the same. You can successfully set up some systems and might even be running them for a while, but without knowing the insides, eventually you get stuck, be it simply your blog or be it some bigger application or more. In my career I did jobs where I overlooked tens of thousands of servers and systems in various regions of the world. With that you cannot rely on gut feelings or wait for a call to alert you about some outage. What you will need is mainly 3 things:
performance data: metrics
Events: logs
a notice if something is going on: alerting
Ideally you also want a one-stop-shop where you get it all together. This is where PLG comes into the game:
Prometheus – Metrics
Loki: Log management
Grafana – alert management, visualization, dashboards and more
“Prometheus tells you how things are performing, Loki tells you why things happened, and Grafana helps you see it all together.”
So let’s look at some scenarios and how that could be all applied.
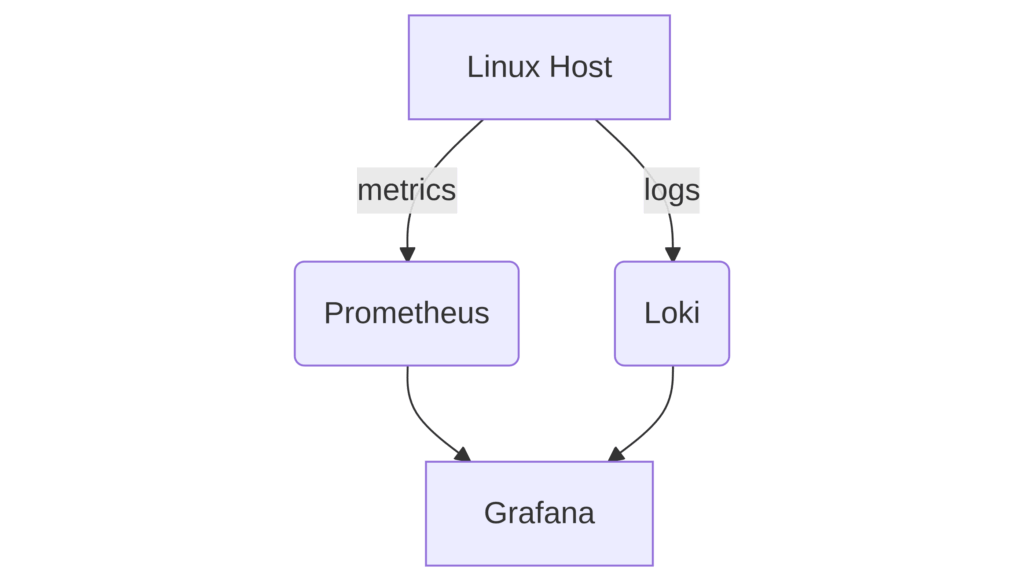
Scenario 1: Plain Linux Nodes
It does not matter too much if we are talking about 5 or 5000 nodes: The principal will be the same:
Advertisements
Prometheus and Loki run as a service somewhere and receive data from the host. Grafana connects to those services and make all the things visible to you.
Grafana does not store any data itself but queries those services from the other end and provides simply the output. However, if you use it for alerting, the alert rules you create will be stored in Grafana, as well as users etc. if you authenticate directly in Grafana
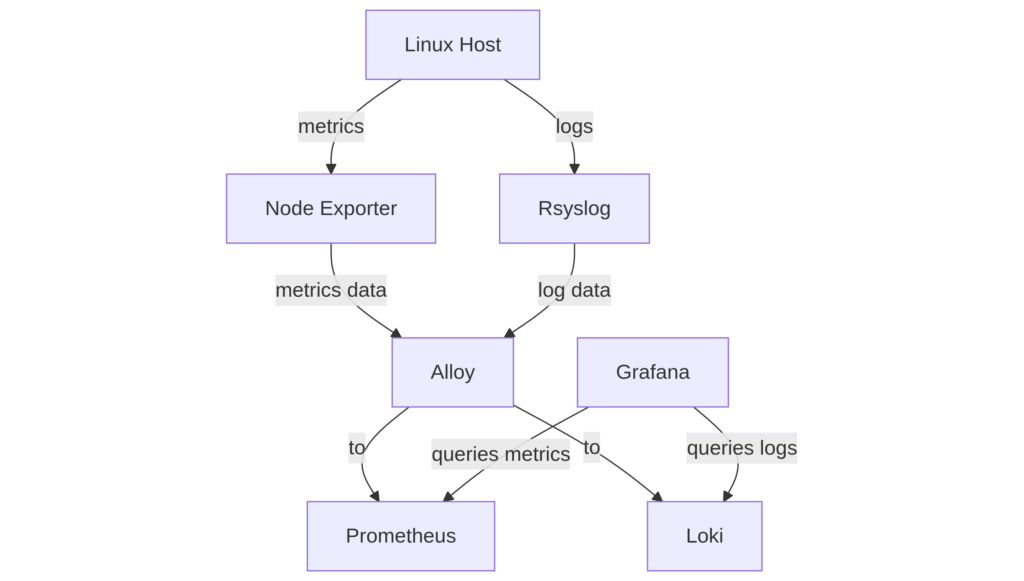
How does your Linux host get his data into Prometheus and Loki: through agents. Now there are a lot of different agents indeed and I cannot specify them all here. In my particular world, I am using Node exporter for creating metrics and the standard Rsyslog daemon for the logs. Then Alloy as agent puts them all forward towards Prometheus and Loki. Haproxy sits somewhere in the middle and does its magic of forwarding fast and furious. But the general flow is always like this:
Now you can set up Grafana to connect to the data sources of Loki and Prometheus, and you almost instantly have a one-stop-shop where you see the status of your systems, performance data, file system usages and logs. Of course there is more to that, like setting up the right labels and telling alloy what to do with it, but that is a topic to be looked at in a post of its own.